Column Analyses
The Column Analyses tab presents statistical analyses and pattern information about the columns that have been profiled. Each column in the input data is listed as a row in the table, which presents information such as data type, value counts, and minimum and maximum values.
Basic analyses
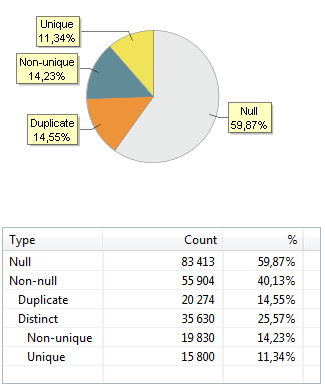
The Basic tab provides simple statistics about the data that was profiled and shows a chart of duplicate and distinct data as a percentage of the whole.
Interpreting counts
The Counts table lists the following values:
-
Null: All records that are empty or have
NULLas their value. -
Non-null: All records that are not empty or
NULL(Duplicate + Distinct). -
Duplicate: The number of values that are the same as other values in the list.
-
Distinct: The number of non-null values that are different from each other (Non-unique + Unique).
-
Non-unique: The number of values that have at least one duplicate in the list.
-
Unique: The number of values that have no duplicates.
To illustrate the meaning of these values, take the following data as an example.
| Record number | Value |
|---|---|
1 |
John Smith |
2 |
John Smith |
3 |
Rebecca Davis |
4 |
Paul Adams |
5 |
The Counts table for this data would be as follows:
| Type | Count | Records | Explanation |
|---|---|---|---|
Null |
1 |
Record 5 |
The last record is empty. |
Non-null |
4 |
Records 1-4 |
The first 4 records contain data. |
Duplicate |
1 |
Record 2 |
There is one duplicate of the John Smith record (Record 1). |
Distinct |
3 |
Records 1, 3, 4 |
These records contain distinct values. |
Non-unique |
1 |
Record 1 |
John Smith has a duplicate record - it isn’t unique. |
Unique |
2 |
Records 3 and 4 |
Rebecca Davis and Paul Adams appear only once in the list, they have no duplicates. |
Frequency analysis
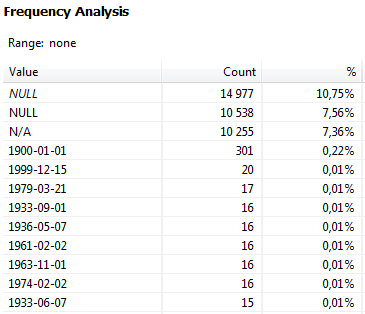
The Frequency Analysis tab shows the number of times each value occurs in the data (shown as both an absolute count and as a percentage of the whole).
Domain analysis
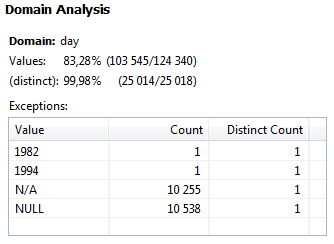
This analysis determines the likely type of data in each column (for example, whether the data is text, a number, or a date). The probable types are listed, along with exceptions (such as a text string found in a list of dates).
Business domain analysis
Business domain analysis tries to determine the kind of data stored in the analyzed column in the business context, for example, name, address, postal code, SWIFT code.
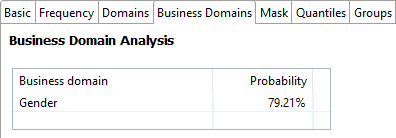
The result shows all matched domains and their probabilities, that is, the percentage of records that match each given domain. By default, if at least 25% of records match one domain, this domain appears in the list of matched domains. For any other domain to appear in the list, it needs to have at least 20% of matched records. These settings can be set in the Profiling step (see Configure the Profiling Step).
In the following example, 79.21% of records match the Gender domain for the selected column. No other domains are shown since the percentage of records that they match is lower than the loose threshold.
Mask analysis
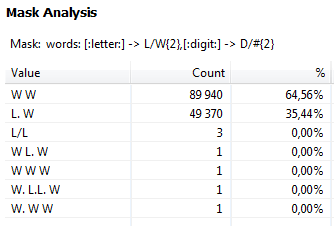
The Mask Analysis tab shows the syntactic patterns of the data, that is, the structure of the data rather than its content. Codes (masks) are used to describe these patterns. For example, the code "W" is used by default to represent a word, while "L" is used to represent a letter.
| The number of letters required to make a word can be defined in the Profiling Step properties. See Configure the Profiling Step. |
This type of analysis can be useful, for example, when looking at a column of names where one or two words are common, but single letters and numbers are not. Finding unexpected patterns in the data can provide information about the overall level of data quality.
Quantiles
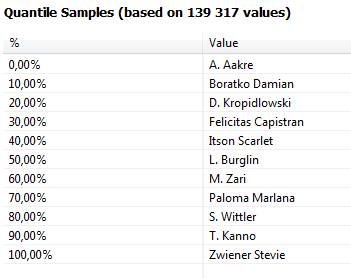
The Quantiles tab displays the data values that occur at designated intervals in the ordered data set. The first value in the list is at 0% and the last value is at 100%. The median value is at the 50% marker.
Group frequency analysis
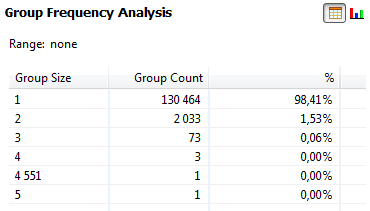
The Groups tab shows the number of times that each non-null frequency count is repeated in the selected column. If all values are unique, the group size is 1 as there are no duplicate values. Each time a value is repeated, it forms a new group.
In the following example, there are 130464 values that have no duplicates, 2033 values that are repeated twice, 73 values which are repeated three times, and so on.
Was this page useful?
