
Debugging Expressions and Steps
When working with functions and regular expressions, it is convenient to check their results on a small sample of data without having to run the plan. This can be done by debugging an expression or a step as a whole.
Regular expressions or functions can be implemented and debugged in different parts of different steps, for example, the Profiling step (in the Data or Business Rules tab), Column Assigner, or Regex Matching step.
Debug a function (expression)
Debugging a function is presented on the example of the Business Rules in the Profiling step.
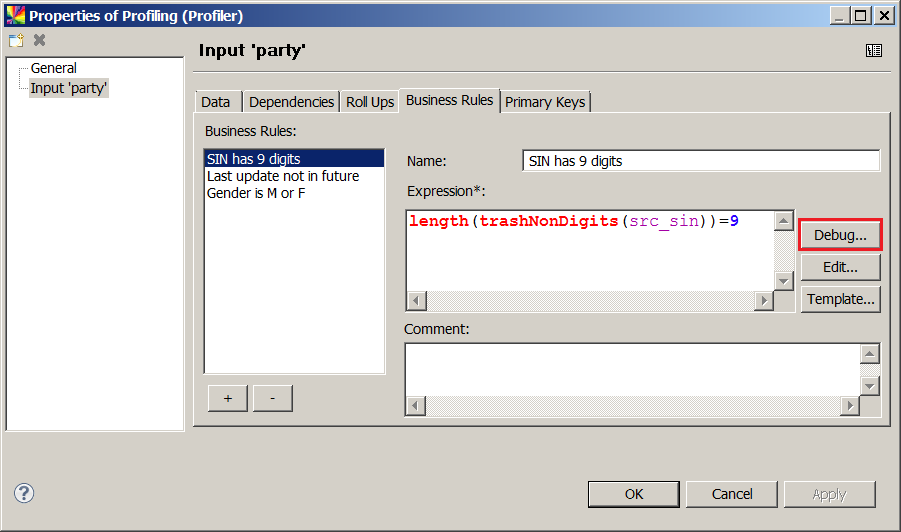
To debug the function (expression), select Debug, after which the following appears:
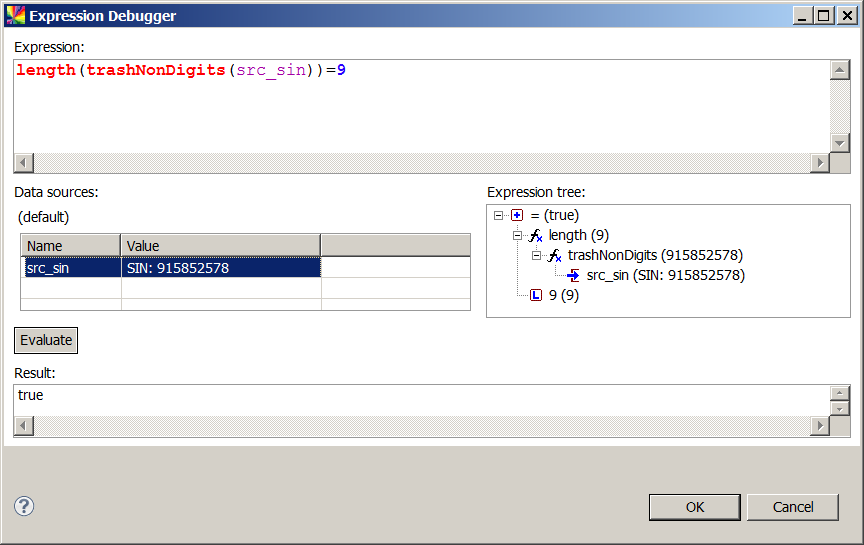
You can edit the expression on the top, enter the data next to the column name, and see the result after clicking Evaluate. Expression tree to the right of the Data sources section shows the evaluation and transformation steps the value goes through before reaching the final result. It also shows the result of each transformation in the brackets.
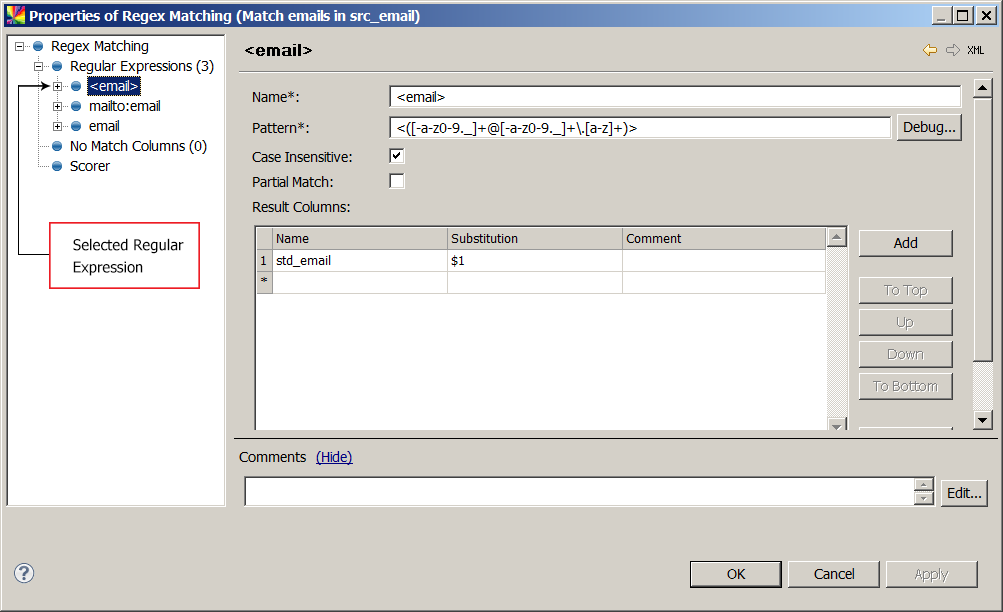
Debug a regular expression
Regular expressions can be debugged in the Regex Matching step.
To debug a regular expression, select it in the navigation panel of the Properties of Regex Matching dialog on the left and select Debug next to the Pattern field.
The following screen appears:
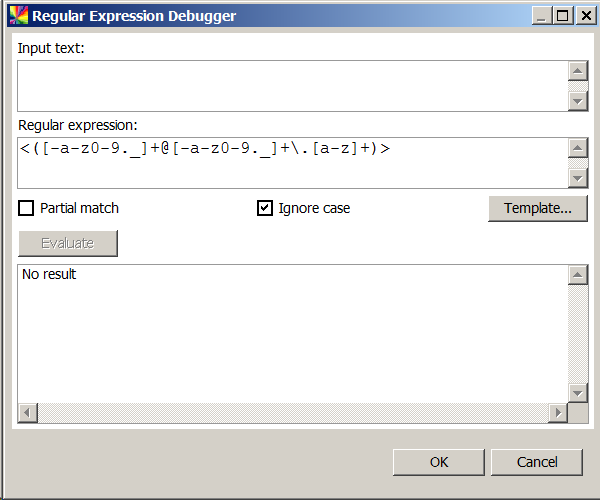
Enter the text into the Input text field and press Evaluate. You will see a few substitution options and their results.
In case you spot an error in your regular expression, you can edit it in the same dialog and repeat the evaluation procedure.
Debug a step
If one step contains several transformations (regular expressions or functions), it is useful to debug the step as a whole to see how the output columns values are affected.
To do that, right-click the step and select Debug. The following screen appears:
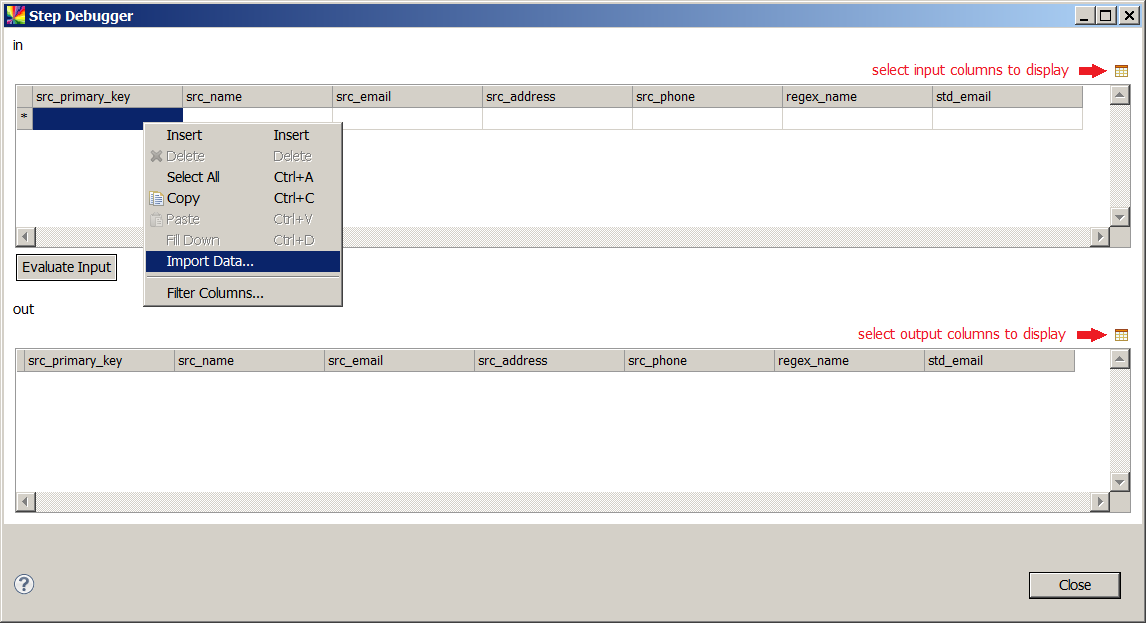
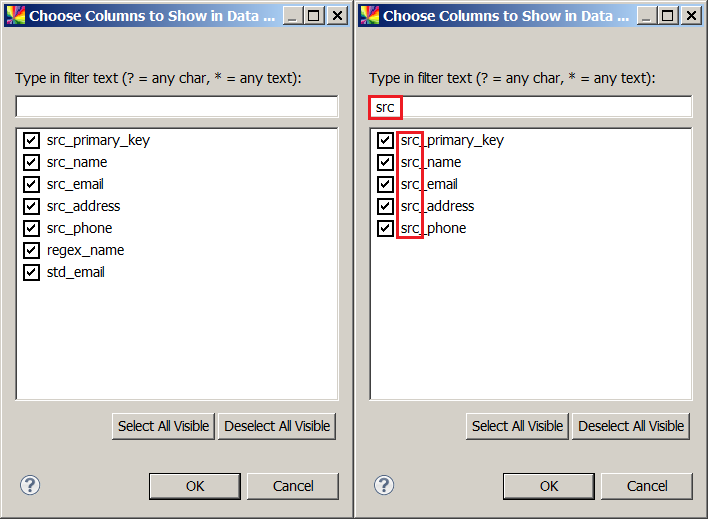
The Step Debugger is divided into two parts: in and out, each listing the same columns, even if some of them are not present in the source data. You can filter out which columns you want to see both in the input and output parts by clicking Filter Columns (a small table icon as pointed out in the previous image).
You can also use the Filter feature, which is useful for narrowing down the selection when dealing with many columns.
The difference with debugging a single expression is that you cannot edit any expressions in this dialog, but you can test your expressions on real data. To do this, right-click anywhere on the in part and select Import Data.
After this, locate the file with input data and select OK. The table is populated with the first 500 rows of data from the selected file.
| The Import Data functionality is not available for databases tables. |
| The imported data should have the same structure (number of columns and column names) as configured in the step, so for a successful import, this action is best performed on the actual data that will be used in the step. |
Was this page useful?