
Data Quality Results Steps
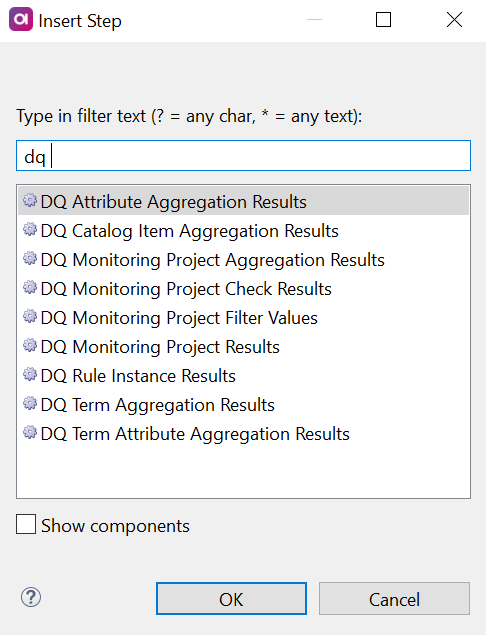
As the ONE Metadata Reader step can no longer retrieve DQ results from monitoring projects or catalog, new steps have been created which can be used in addition to the ONE Metadata Reader (or other input steps). These steps mimic the API calls created for the same purpose and return DQ results.
Prerequisites
-
A connection to ONE Ataccama Platform is set up and running. See Connect to Ataccama ONE Platform.
-
Input data.
-
Add an input with the data for which you want to retrieve results. You need the appropriate Input step or the ONE Metadata Reader step.
It is possible to drag and drop some files directly onto the canvas, or configure the steps from scratch (that is, map the columns to entities in ONE) by inserting the step and following the instructions found in the associated reference documentation in ONE Desktop). If multiple input steps are required, use a Join step and then create a connection from Join to the new step.
Depending on the step you wish to use to retrieve results, different parameters are required in the input. See the individual step information for mandatory inputs.
-
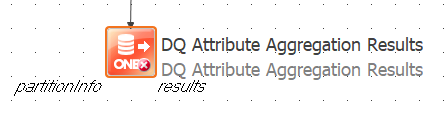
DQ Attribute Aggregation Results
This step returns results of certain DQ aggregations for attributes.
-
In your Input step, make sure you have mappings to ONE for all required parameters, and optional parameters as desired:
-
Attribute ID (required): A list of attribute identifiers each with an optional list of aggregation identifiers (aggregation identiifers can be for example the identifier of a dimension).
-
Catalog Item ID (required): Catalog item identifier.
-
Limit and time ranges: Optionally, define the number of runs which should be returned and a start and end date of time range.
For example, to be able to map the new step to catalog ID information in the next part of this flow, you could configure the ONE Metadata Reader with Entity Type: Catalog Itemand Id Column Name:catalogItemId.
-
-
Add a DQ Attribute Aggregation Results step to the canvas.
-
Add a connection to the DQ Attribute Aggregation Results step from the input step (or from the Join step if multiple inputs are used).
-
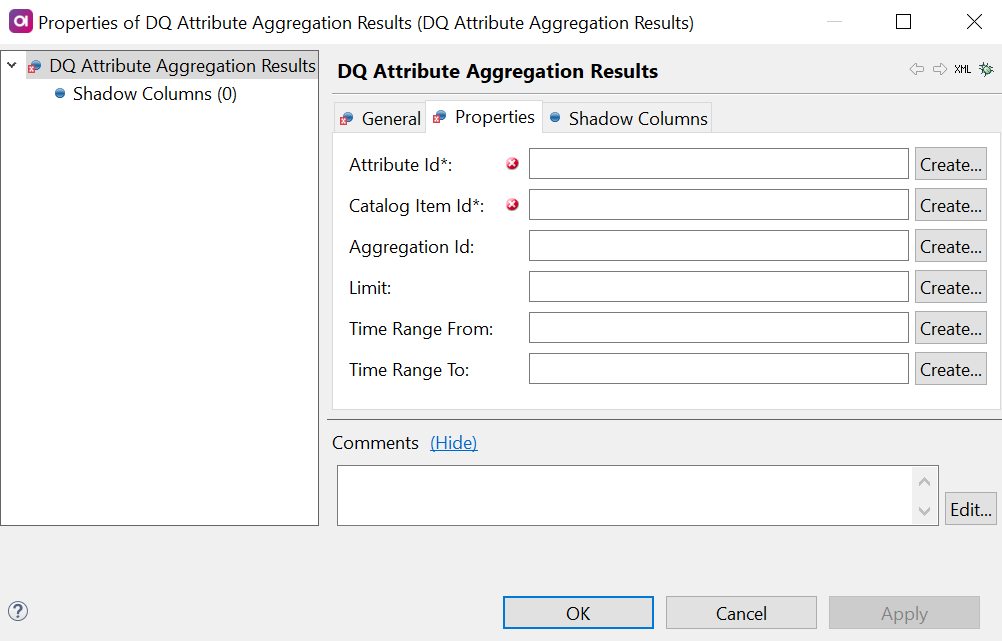
Double-click the DQ Attribute Aggregation Results step and on the Properties tab:
-
Add the identifiers of the corresponding columns from the input in the fields available:
-
Attribute Id (required): Column from the previous steps in the flow which is mapped to the attribute ID information.
-
Catalog Item Id (required): Column from the previous steps in the flow which is mapped to the catalog item ID information.
-
Aggregation Id: Column from the previous steps in the flow which is mapped to the aggregation ID information.
-
Limit: Column from the previous steps in the flow which is mapped to the limit definition.
-
Time Range From: Column from the previous steps in the flow which is mapped to the start date of the specified time range.
-
Time Range To: Column from the previous steps in the flow which is mapped to the end date of the specified time range.
-
-
Alternatively, select Create to add a shadow column in the previous step in the flow and map this field to that column.
-
-
Optionally, define a shadow columns to add a column of a specific type in the output format. The created column can contain initial data as a result of the ONE Metadata Reader
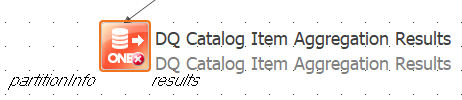
Default Expression.This step has two outputs by default: partition information and results. Remove connections as required if you do not want a particular output to be created.
DQ Catalog Item Aggregation Results
This step returns results of DQ aggregations for a catalog item.
-
In your Input step, make sure you have mappings to ONE for all required parameters, and optional parameters as desired:
-
Catalog Item ID (required): Catalog item identifiers.
-
Aggregation ID: A list of aggregation identifiers (for example the identifier of a dimension).
-
Limit and time ranges: Optionally, define the number of runs which should be returned and a start and end date of time range.
For example, to be able to map the new step to catalog ID information in the next part of this flow, you could configure the ONE Metadata Reader with Entity Type: Catalog Itemand Id Column Name:catalogItemId.
-
-
Add a DQ Catalog Item Aggregation Results step to the canvas.
-
Add an connection to the DQ Catalog Item Aggregation Results step from the input step (or from the Join step if multiple inputs are used).
-
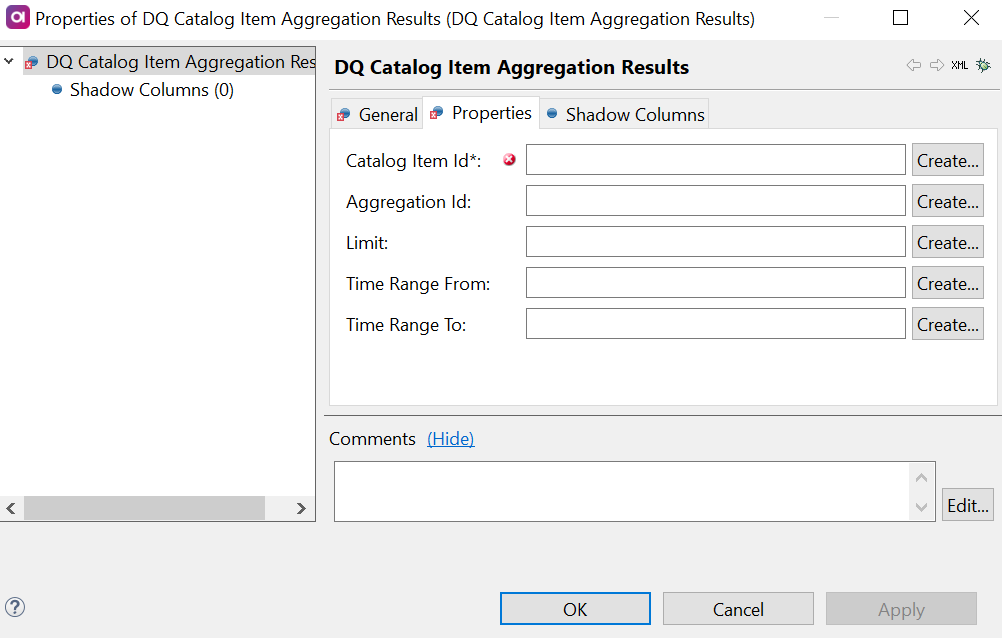
Double-click the DQ Catalog Item Aggregation Results step and on the Properties tab:
-
Add the identifiers of the corresponding columns from the input in the fields available:
-
Catalog Item Id (required): Column from the previous steps in the flow which is mapped to the catalog item ID information.
-
Aggregation Id: Column from the previous steps in the flow which is mapped to the aggregation ID information.
-
Limit: Column from the previous steps in the flow which is mapped to the limit definition.
-
Time Range From: Column from the previous steps in the flow which is mapped to the start date of the specified time range.
-
Time Range To: Column from the previous steps in the flow which is mapped to the end date of the specified time range.
-
-
Alternatively, select Create to add a shadow column in the previous step in the flow and map this field to that column.
-
-
Optionally, define a shadow column to add a column of a specific type in the output format. The created column can contain initial data as a result of the ONE Metadata Reader
Default Expression.This step has two outputs by default: partition information and results. Remove connections as required if you do not want a particular output to be created.
DQ Rule Instance Results
This step returns results of DQ rule instances. Results include also explanations of invalidity.
-
In your Input step, make sure you have mappings to ONE for all required parameters, and optional parameters as desired:
-
Attribute ID: A list of attribute identiifers each with an optional list of rule instance identifiers.
-
Catalog Item ID (required): Catalog item identifiers.
-
Limit and time ranges: Optionally, define the number of runs which should be returned and a start and end date of time range.
For example, to be able to map the new step to catalog ID information in the next part of this flow, you could configure the ONE Metadata Reader with Entity Type: Catalog Itemand Id Column Name:catalogItemId.
-
-
Add a DQ Rule Instance Results step to the canvas.
-
Add a connection to the DQ Rule Instance Results step from the input step (or from the Join step if multiple inputs are used).
-
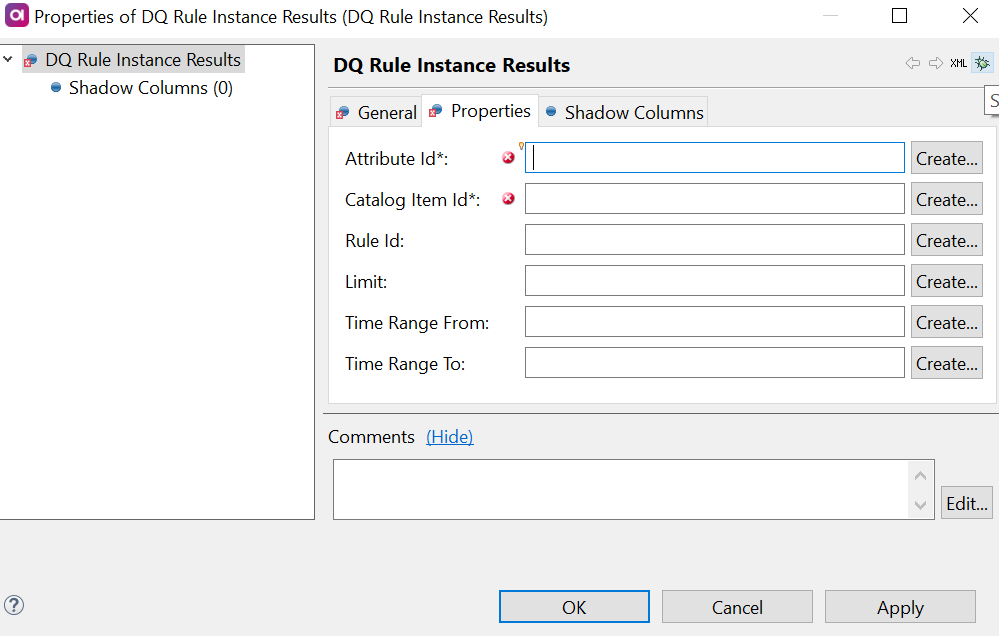
Double-click the DQ Rule Instance Results step and on the Properties tab:
-
Add the identifiers of the corresponding columns from the input in the fields available:
-
Attribute Id (required): Column from the previous steps in the flow which is mapped to the attribute ID information.
-
Catalog Item Id (required): Column from the previous steps in the flow which is mapped to the catalog item ID information.
-
Rule Id: Column from the previous steps in the flow which is mapped to the aggregation ID information.
-
Limit: Column from the previous steps in the flow which is mapped to the limit definition.
-
Time Range From: Column from the previous steps in the flow which is mapped to the start date of the specified time range.
-
Time Range To: Column from the previous steps in the flow which is mapped to the end date of the specified time range.
-
-
Alternatively, select Create to add a shadow column in the previous step in the flow and map this field to that column.
-
-
Optionally, define a shadow column to add a column of a specific type in the output format. The created column can contain initial data as a result of the ONE Metadata Reader
Default Expression.This step has three outputs by default: partition information, explanations of invalidity, and results (count). Remove connections as required if you do not want a particular output to be created.
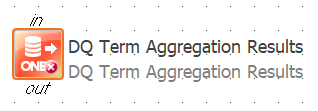
DQ Term Aggregation Results
This step takes last results from all attributes where the term is assigned and returns aggregated DQ results for the whole term.
-
In your Input step, make sure you have mappings to ONE for all required parameters, and optional parameters as desired:
-
Term ID (required): Term identifiers.
-
Optionally, define the moment in time you are interested in. Mapping the At field to this information later means all runs after this time are excluded from the aggregation.
-
-
Add a DQ Term Aggregation Results step to the canvas.
-
Add a connection to the DQ Term Aggregation Results step from the input step (or from the Join step if multiple inputs are used).
-
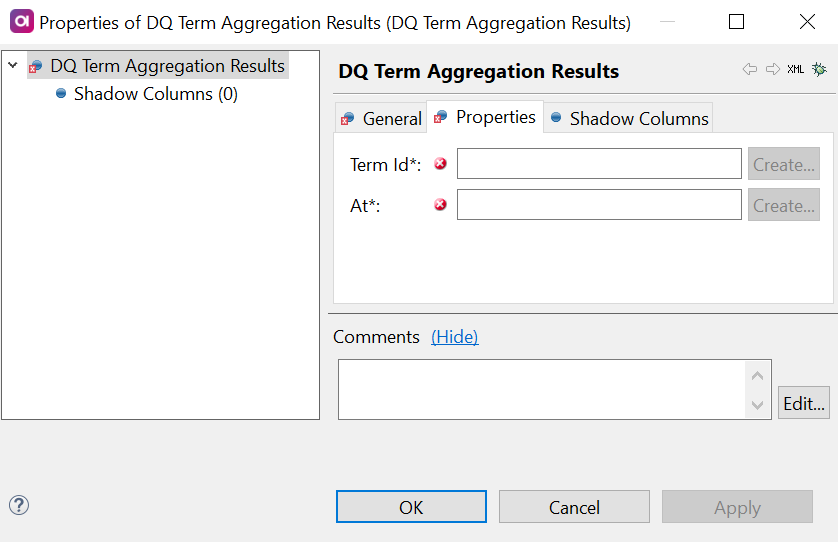
Double-click the DQ Term Aggregation Results step and on the Properties tab:
-
Add the identifiers of the corresponding columns from the input in the fields available:
-
Term Id (required): Column from the previous steps in the flow which is mapped to the term ID information.
-
At: Column from the previous steps in the flow which contains timestamp information for the moment of interest. All runs after this time are excluded from the aggregation.
-
-
Alternatively, select Create to add a shadow column in the previous step in the flow and map this field to that column.
-
-
Optionally, define a shadow column to add a column of a specific type in the output format. The created column can contain initial data as a result of the ONE Metadata Reader
Default Expression.
DQ Term Attribute Aggregation Results
This step returns results of term aggregation for an attribute.
-
In your Input step, make sure you have mappings to ONE for all required parameters, and optional parameters as desired:
-
Term ID (required): Term identifiers.
-
Attribute ID (required): A list of attribute identifiers.
-
Limit and time ranges: Optionally, define the number of runs which should be returned and a start and end date of time range.
-
-
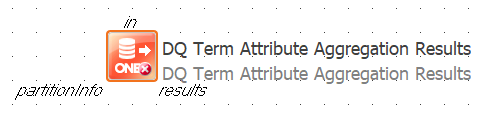
Add a DQ Term Attribute Aggregation Results step to the canvas.
-
Add an connection to the DQ Term Attribute Aggregation Results step from the input step (or from the Join step if multiple inputs are used).
-
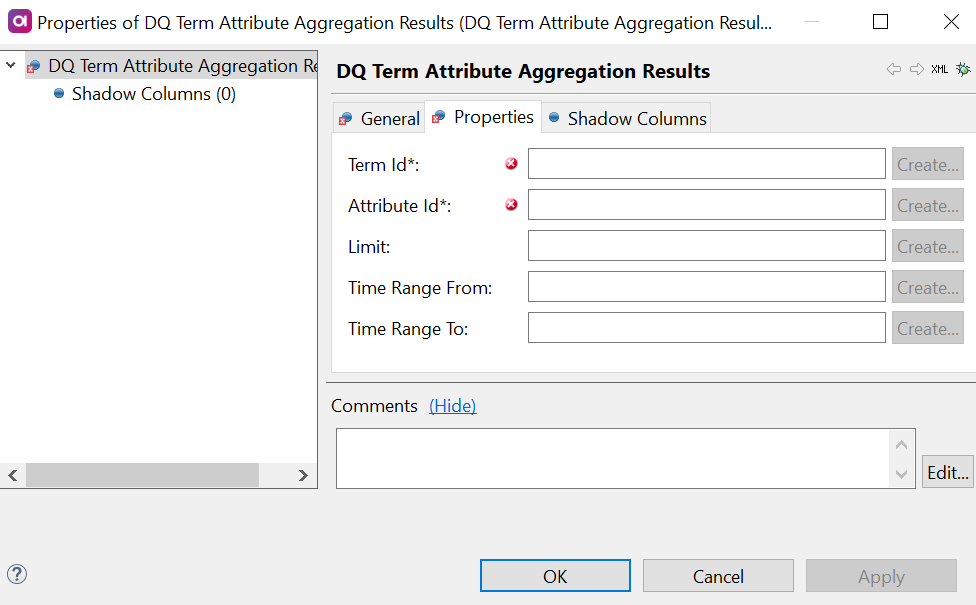
Double-click the DQ Term Attribute Aggregation Results step and on the Properties tab:
-
Add the identifiers of the corresponding columns from the input in the fields available:
-
*Term Id (required): Column from the previous steps in the flow which is mapped to the term ID information.
-
Attribute Id (required): Column from the previous steps in the flow which is mapped to the attribute ID information.
-
Limit: Column from the previous steps in the flow which is mapped to the limit definition.
-
Time Range From: Column from the previous steps in the flow which is mapped to the start date of the specified time range.
-
Time Range To: Column from the previous steps in the flow which is mapped to the end date of the specified time range.
-
-
Alternatively, select Create to add a shadow column in the previous step in the flow and map this field to that column.
-
-
Optionally, define a shadow column to add a column of a specific type in the output format. The created column can contain initial data as a result of the ONE Metadata Reader
Default Expression.This step has two outputs by default: partition information and results. Remove connections as required if you do not want a particular output to be created.
DQ Monitoring Project Aggregation Results
This step returns results of certain aggregations (custom, catalog item level, attribute level).
-
In your Input step, make sure you have mappings to ONE for all required parameters, and optional parameters as desired:
-
Monitoring Project Id (required): Monitoring project identifiers.
-
Catalog Item ID (required): A list of catalog item identifiers (not the identifier of the catalog item instance).
-
Aggregation ID (required): A list of aggregation identifiers. This could be custom aggregation identifier, catalog item identifier (to aggregate all checks), or attribute identifier (to aggregate all attribute checks).
-
Limit and time ranges: Optionally, define the number of runs which should be returned and a start and end date of time range.
-
-
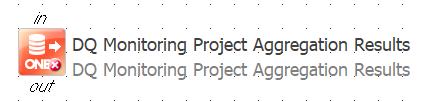
Add a DQ Monitoring Project Aggregation Results step to the canvas.
-
Add a connection to the DQ Monitoring Project Aggregation Results step from the input step (or from the Join step if multiple inputs are used).
-
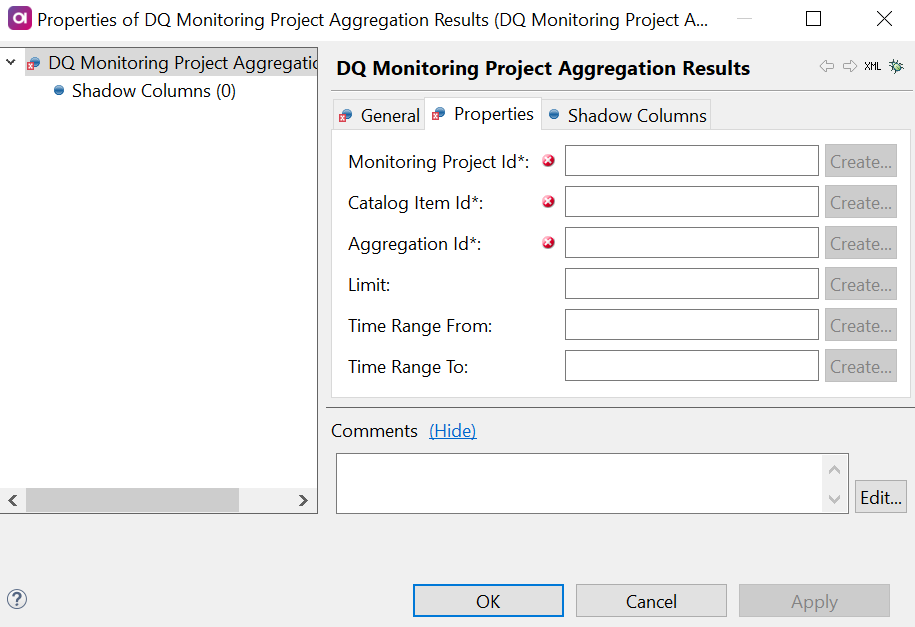
Double-click the DQ Monitoring Project Aggregation Results step and on the Properties tab:
-
Add the identifiers of the corresponding columns from the input in the fields available:
-
Monitoring Project Id (required): Column from the previous steps in the flow which is mapped to the monitoring project ID information.
-
Catalog Item Id (required): Column from the previous steps in the flow mapped to the catalog item ID information.
-
Aggregation Id: Column from the previous steps in the flow which is mapped to the aggregation ID information.
-
Limit: Column from the previous steps in the flow which is mapped to the limit definition.
-
Time Range From: Column from the previous steps in the flow which is mapped to the the start date of the specified time range.
-
Time Range To: Column from the previous steps in the flow which is mapped to the end date of the specified time range.
-
-
Alternatively, select Create to add a shadow column in the previous step in the flow and map this field to that column.
-
-
Optionally, define a shadow columns to add a column of a specific type in the output format. The created column can contain initial data as a result of the ONE Metadata Reader
Default Expression. -
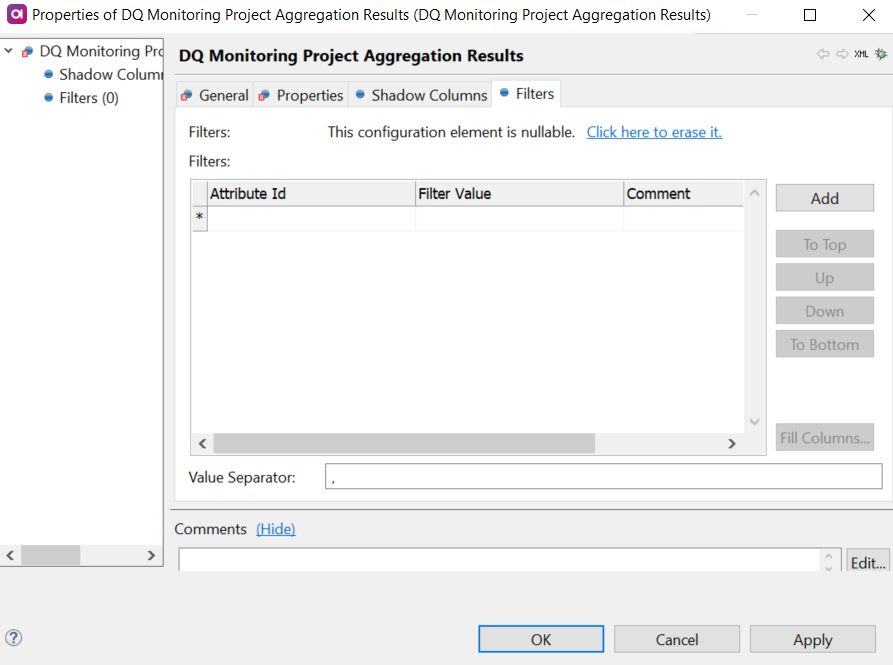
Optionally, define attribute filters to filter project results and project aggregation results. To do this:
-
Select the Filters tab and create a new configuration.
-
In Attribute Id, provide the identifier of the attribute you would like to be able to filter by.
-
In Filter Value, add the attribute values you would like to be able to select in the filter. You can only add values which are present in the selected attribute.
When adding multiple values, the separator is a comma (
,) by default. This can be changed by editing the entry in Value Separator.
-
Select Add to define another attribute filter and repeat steps 6a-6c or select OK if you are done.
-
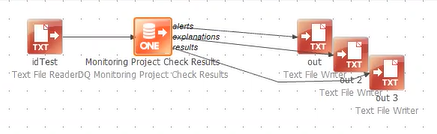
DQ Monitoring Project Check Results
This step returns results of certain aggregations (custom, catalog item level, attribute level).
-
In your Input step, make sure you have mappings to ONE for all required parameters, and optional parameters as desired:
-
Monitoring Project Id (required): Monitoring project identifiers.
-
Catalog Item ID (required): A list of catalog item identifiers (not the identifier of the catalog item instance).
-
DQ Check ID (required): A list of DQ check identifiers.
-
Limit and time ranges: Optionally, define the number of runs which should be returned and a start and end date of time range.
-
-
Add a DQ Monitoring Project Check Results step to the canvas.
-
Add a connection to the DQ Monitoring Project Check Results step from the input step (or from the Join step if multiple inputs are used).
-
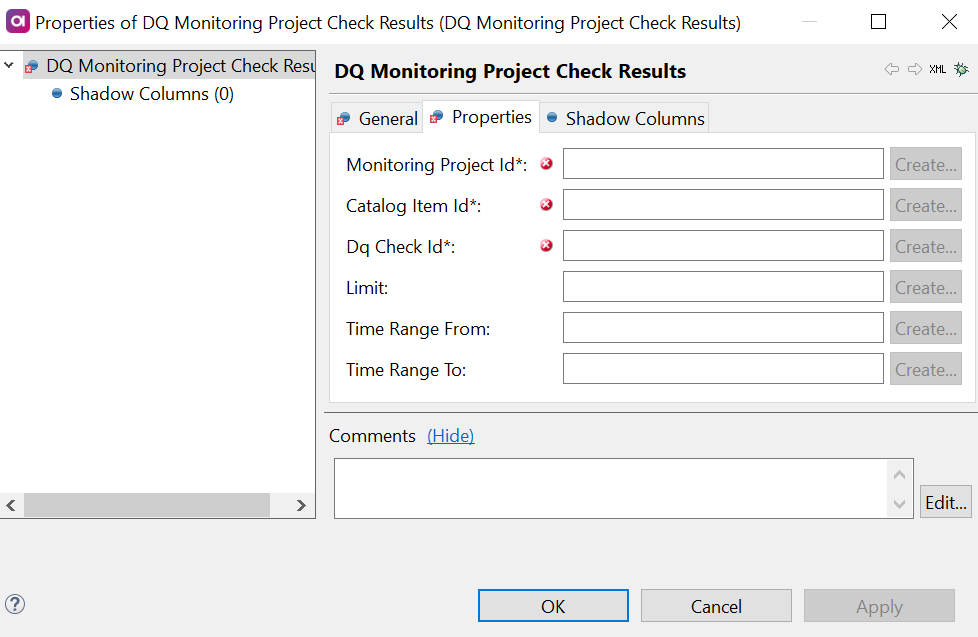
Double-click the DQ Monitoring Project Check Results step and on the Properties tab:
-
Add the identifiers of the corresponding columns from the input in the fields available:
-
Monitoring Project Id (required): Column from the previous steps in the flow which is mapped to the monitoring project ID information.
-
Catalog Item Id (required): Column from the previous steps in the flow which is mapped to the catalog item ID information.
-
DQ Check Id: Column from the previous steps in the flow which is mapped to the DQ check ID information.
-
Limit: Column from the previous steps in the flow which is mapped to the limit definition.
-
Time Range From: Column from the previous steps in the flow which is mapped to the start date of the specified time range.
-
Time Range To: Column from the previous steps in the flow which is mapped to the end date of the specified time range.
-
-
Alternatively, select Create to add a shadow column in the previous step in the flow and map this field to that column.
-
-
Optionally, define a shadow column to add a column of a specific type in the output format. The created column can contain initial data as a result of the ONE Metadata Reader
Default Expression. -
Optionally, define attribute filters to filter project results and project aggregation results. To do this:
-
Select the Filters tab and create a new configuration.
-
In Attribute Id, provide the identifier of the attribute you would like to be able to filter by.
-
In Filter Value, add the attribute values you would like to be able to select in the filter. You can only add values which are present in the selected attribute.
When adding multiple values, the separator is a comma (
,) by default. This can be changed by editing the entry in Value Separator.
-
Select Add to define another attribute filter and repeat steps 6a-6c or select OK if you are done.
This step has three outputs by default: alerts, explanations of invalidity, and results. Remove connections as required if you do not want a particular output to be created.
-
DQ Monitoring Project Filter Values
This step returns data values of filter attributes (these values can change in each processing).
-
In your Input step, make sure you have mappings to ONE for all required parameters, and optional parameters as desired:
-
Monitoring Project Id (required): Monitoring project processing identifiers.
-
Catalog Item ID (required): Identifier of the catalog item for which you want the filter values.
-
-
Add a DQ Monitoring Project Filter Values step to the canvas.
-
Add a connection to the DQ Monitoring Filter Values step from the input step (or from the Join step if multiple inputs are used).
-
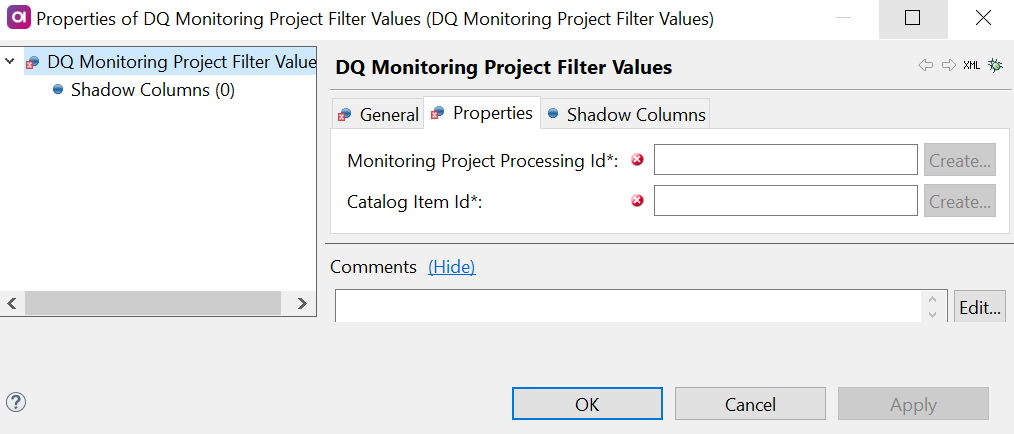
Double-click the DQ Monitoring Project Filter Values step and on the Properties tab:
-
Add the identifiers of the corresponding columns from the input in the fields available:
-
Monitoring Project Processing Id (required): Column from the previous steps in the flow mapped to the monitoring project processing ID information.
-
Catalog Item Id (required): Column from the previous steps in the flow mapped to the catalog item ID information.
-
-
Alternatively, select Create to add a shadow column in the previous step in the flow and map this field to that column.
-
-
Optionally, define a shadow columns to add a column of a specific type in the output format. The created column can contain initial data as a result of the ONE Metadata Reader
Default Expression.
DQ Monitoring Project Results
This step returns project validity results over time. The results are aggregated over all catalog items in the monitoring project.
-
In your Input step, make sure you have mappings to ONE for all required parameters, and optional parameters as desired:
-
Monitoring Project Id (required): Monitoring project identifiers.
-
Limit and time ranges: Optionally, define the number of runs which should be returned and a start and end date of time range.
-
-
Add a DQ Monitoring Project Results step to the canvas.
-
Add a connection to the DQ Monitoring Project Results step from the input step (or from the Join step if multiple inputs are used).
-
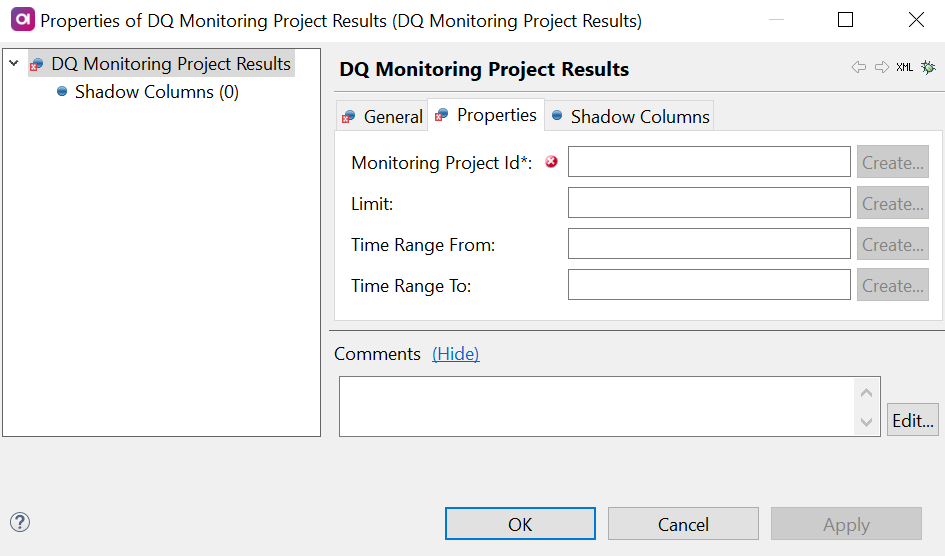
Double-click the DQ Monitoring Project Results step and on the Properties tab:
-
Add the identifiers of the corresponding columns from the input in the fields available:
-
Monitoring Project Id (required): Column from the previous steps in the flow which is mapped to the monitoring project ID information.
-
Limit: Column from the previous steps in the flow which is mapped to the limit definition.
-
Time Range From: Column from the previous steps in the flow which is mapped to the start date of the specified time range.
-
Time Range To: Column from the previous steps in the flow which is mapped to the end date of the specified time range.
-
-
Alternatively, select Create to add a shadow column in the previous step in the flow and map this field to that column.
-
-
Optionally, define a shadow column to add a column of a specific type in the output format. The created column can contain initial data as a result of the ONE Metadata Reader
Default Expression.
| This step has three outputs by default: alerts, explanations of invalidity, and results. Remove connections as required if you do not want a particular output to be created. |
Was this page useful?