
Processing Center
You can use the Processing Center to see the status of jobs in the application, view scheduled jobs, and cancel running jobs.
View jobs
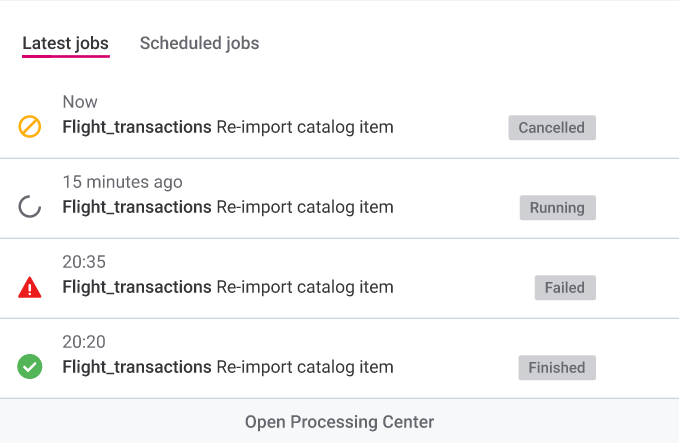
To open the notifications view of the Processing Center, showing a number of most recent notifications, select the Processing Center icon in the main navigation menu (1). To open the fullscreen view, select Open Processing Center under the list of notifications (2).
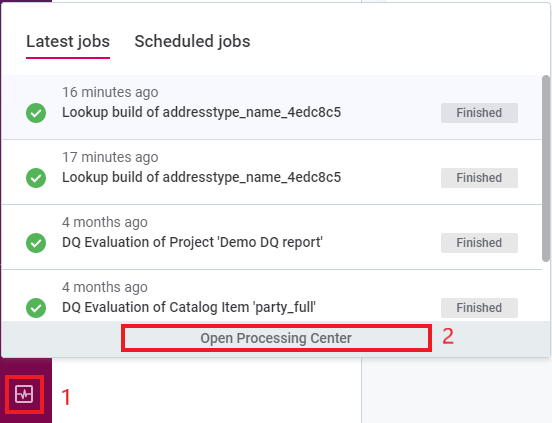
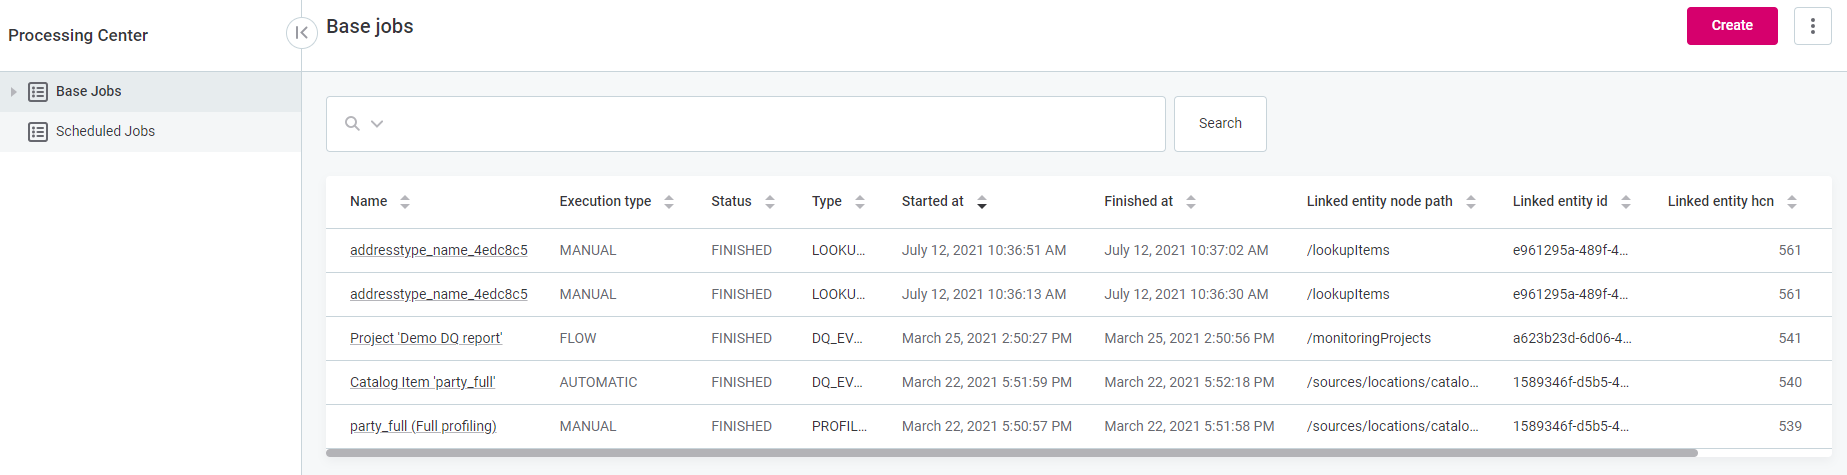
In the fullscreen view, you can see both the executed jobs (Base Jobs) and the Scheduled Jobs.
| You cannot create or edit jobs from the Processing Center. |
Mute job notifications
| Only users with the ONE Administrator role can mute job notifications. |
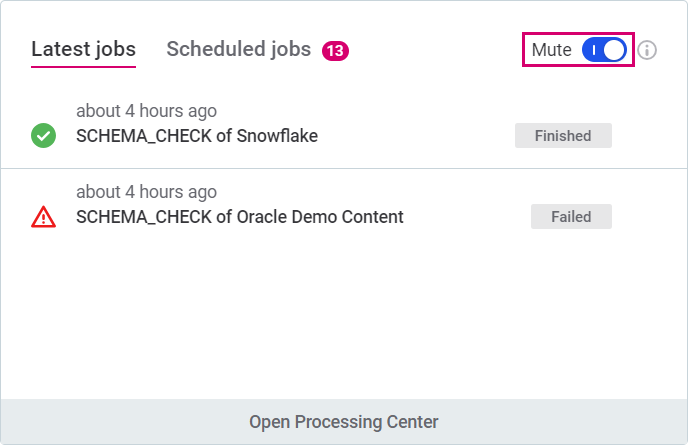
It is possible to pause the pop-up notifications about the progress of all jobs for all users. This is useful in setups where you might receive an excessive amount of notifications, for example, when you are regularly processing high volumes of data. Error and other types of notifications are still displayed.
To pause the notifications, select the Processing Center icon in the main navigation menu and enable the Mute option.
Cancel running jobs
You can cancel a job which is not yet completed.
Cancellation can fail if the job was too far into the process at the time of cancellation. Additionally, cancelling one job can affect other running jobs.
We recommend checking the Processing Center afterwards to make sure the job was cancelled successfully and to see if any other jobs are affected.
To cancel a job:
-
Go to the Processing Center by selecting the icon in the navigation menu.
-
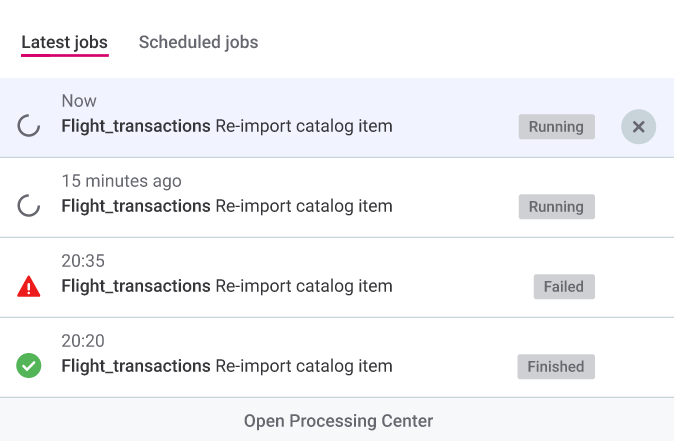
Hover over the running job that you want to cancel and select the cross icon.
-
Confirm by selecting Cancel Job. The status of the job changes to Cancelled:
Troubleshooting
Job stays in Submitted status after a long period of inactivity
- Problem
-
After ONE has been idle for a long time, for example, over 12h, the first subsequent job does not progress past the
Submittedstate. Any following jobs are performed without issues. - Possible cause
-
There is an issue with how the logging context is cleared after a subscription attempt fails.
- Possible solution
-
There are two options depending on whether you need to use auditing in Data Processing Module (DPM) or not:
-
Auditing can be disabled.
If auditing is already enabled in DPM, you can turn it off by setting the property
ataccama.audit.enabled=falsein DPM configuration.For more information, see DPM Configuration, section Audit configuration.
-
Auditing cannot be disabled.
If you need to continue using auditing, set the property
ataccama.authentication.internal.jwt.generator.streamingTokenExpirationin DPM configuration to a value that exceeds the expected idle period, for example,18h.The property accepts the following units: ns(nanoseconds),us(microseconds),ms(milliseconds),s(seconds),m(minutes),h(hours),d(days).Keep in mind that extending the validity of the JWT token can potentially lead to security issues as the subscription can remain active even after the token has been revoked.
-
Runtime job takes too long to process
- Problem
-
Runtime job takes too long to process.
- Possible solution
-
Enable performance profiling in the Global Runtime Configuration. This way you can view the individual runtime steps to identify performance issues that might have occurred during execution.
To enable profiling, add the following configuration in the Runtime Configuration section of the DPM Admin Console. For more information, see DPM and DPE Configuration in DPM Admin Console, section Runtime configuration.
The file names are arbitrary, however, we recommend keeping them reasonably short and avoiding any special characters and spaces. Example<?xml version='1.0' encoding='UTF-8'?> <runtimeConfiguration> <runtimeComponents> <runtimeComponent samplingPeriod="20" class="com.ataccama.dqc.processor.monitoring.sampling.SamplingComponent"> <writers> <writer filename="dqc_sampling_output.txt" stdout="false" detailed="true" class="com.ataccama.dqc.processor.monitoring.sampling.writer.SamplingTextWriter"/> <writer filename="dqc_sampling_output.dot" stdout="false" class="com.ataccama.dqc.processor.monitoring.sampling.writer.SamplingDotWriter"/> </writers> </runtimeComponent> </runtimeComponents> </runtimeConfiguration>
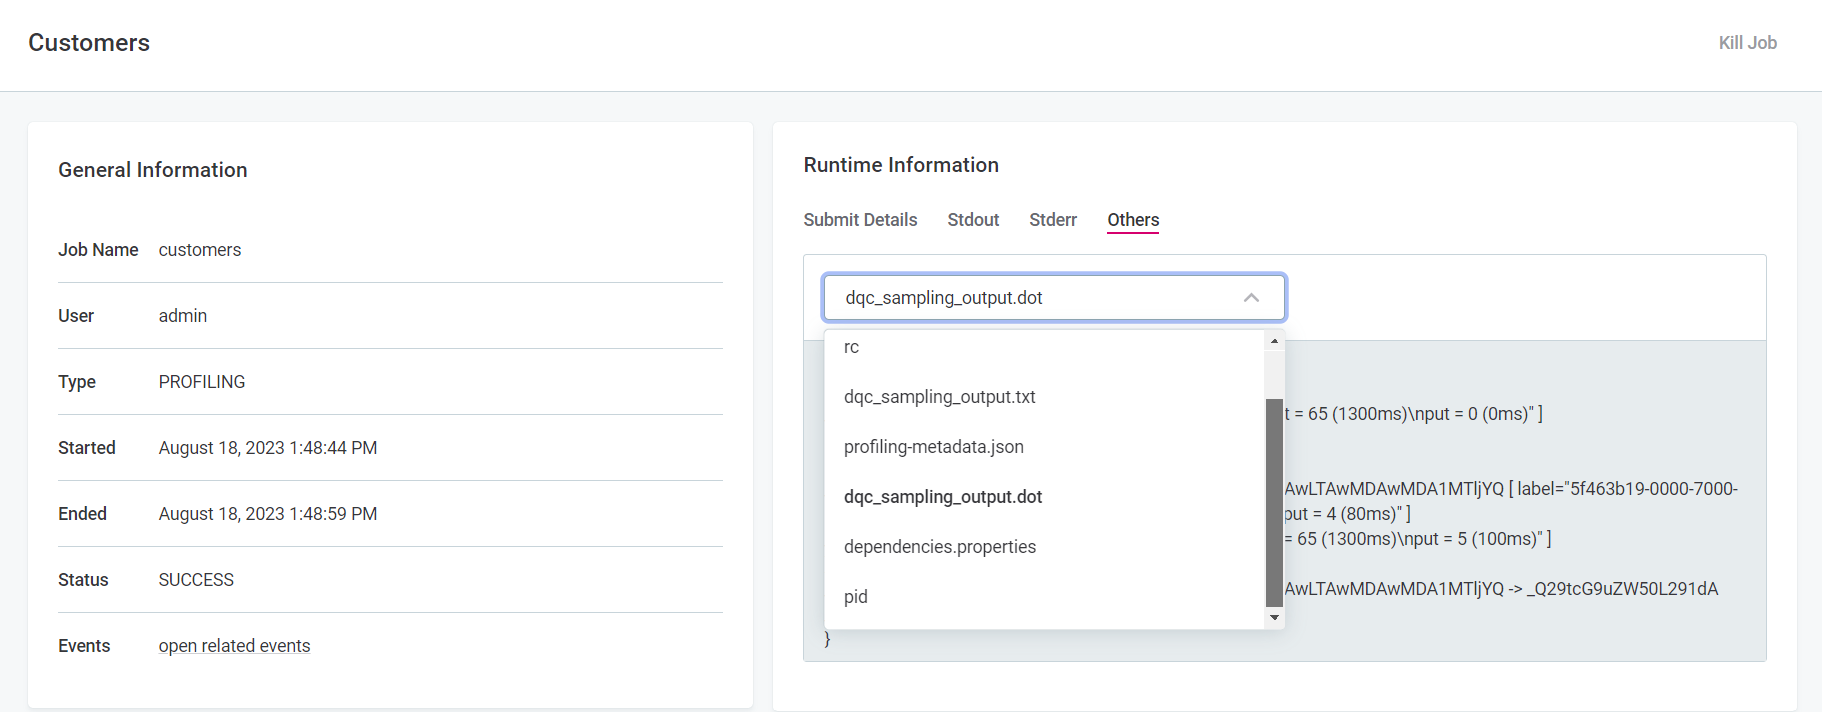
After performance profiling has been enabled, run the job again in ONE. Next, in DPM Admin Console, go to Jobs, select the job name and then switch to the Others tab.
There are two files listed, one a .txt file with the raw text, the other a .dot file with the Graphviz source code.
You can use either of the two files to help identify possible performance issues, however the .dot file is better suited for more complex performance issues.
|
We recommend using a graph renderer to visualize the graph defined in the source code of the
|
Was this page useful?