
Configure the Profiling Step
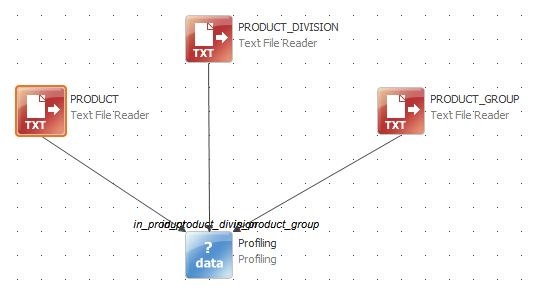
If you choose to create a profile using a plan, a Profiling step appears on the canvas, connected to a data source.
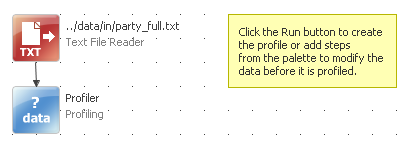
This simple plan contains two steps: one for reading the data and the other for generate the profile.
This article describes the configuration options of the Profiling step.
Double-click the Profiling step to open the Profiling Step Editor. Here you can modify the existing configuration and add additional analyses to run.
There are two categories of settings in the Profiling Step Editor: General, which apply to all inputs, and Input-specific, which apply separately to each input.
General settings
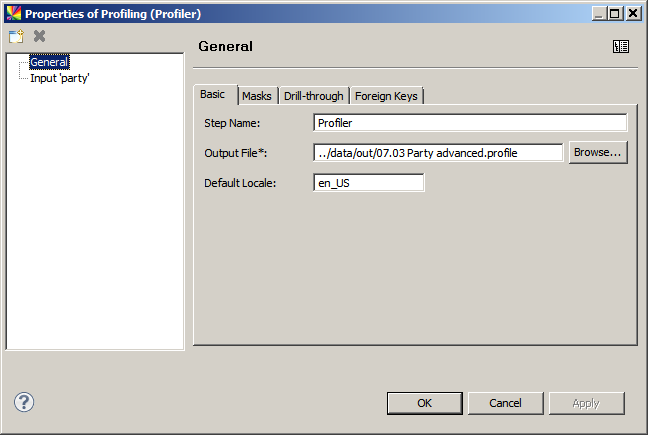
Basic
The Basic tab contains fields for specifying the step name, output file name and location, and default locale for the generated files.
Masks
The Masks tab contains the masks that have been defined. This is also where you can create and edit masks.
A mask is a way of showing the structure of the data rather than the content. To describe patterns in the data, user-defined codes are applied instead of the actual characters.
For example, the mask "D" could be used to represent a digit, while "L" could be used to represent a letter. The codes and rules for the masks can be defined here.
You can assign any of the created masks to the columns in your data on the Data tab for each of your inputs. See Data.
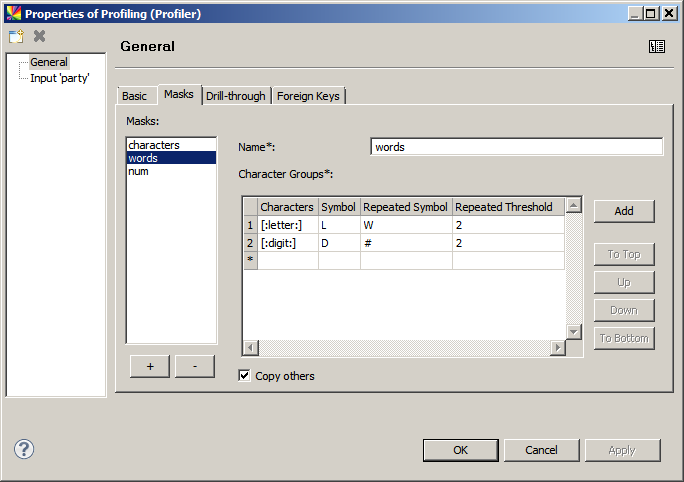
Each mask configuration contains the following settings:
-
Characters: The type (or types) of characters that should be masked. The predefined types are
[:all:],[:letter:],[:lowercase:],[:uppercase:],[:digit:], and[:white:], where[:white:]means all whitespace characters (for example, spaces). Multiple characters can be used in the same mask (for example,[:digit:][:white:]).Characters that are not masked are shown as they are in the data when Copy others is selected. For example, if only numbers are masked, the Mask results could show "# main street" in an address field, where
#is a numerical mask for a sequence of digits. -
Symbol: The symbol used to represent a single character, for example, "L" for letter.
-
Repeated Symbol: The character used to represent a sequence of characters defined in the Characters field. For example, "W" for a sequence of more than 2 letters.
-
Repeated Threshold: The minimum number of characters representing a sequence. For example, the minimum number of letters in a row to be considered a word.
To mask all characters individually regardless of the sequence left, leave the fields Repeated Symbol and Repeated Threshold blank.
To create a new mask, select the plus sign (+) at the bottom of the list of masks.
To delete a mask, use the minus sign (-).
A mask can contain multiple masking rules (called character groups), as shown previously. To add a new character group, select Add.
The order of character groups might be important when creating a mask with several character groups, one of which is a subset of another, especially when the [:all:] character type is used in conjunction with other types.
For example, if you want to mark all letters with "L", all digits with "D", and any other symbol with a dollar sign ("$"), the rule containing [:all:] should be placed last in the list.
Use To Top, Up, Down, and To Bottom options to change the placing of rules relative to each other.
Drill-through
The Drill-through tab specifies whether the drill-through functionality is used or not. Enabling drill-through allows to inspect the individual records that comprise the generated statistics and other measures shown in the Profile viewer.
Because it stores additional fields, it requires a database connection for use.
To allow drill-through in the generated profile, select Enable Drill-through.

The following parameters are available:
-
Database Name: Name of a connected database to use for storing drill-through tables. For a list of available databases, press Ctrl+Space.
-
Table Prefix: Optional prefix which is added to the drill-through tables created for this profile.
-
Display Limit. Optional parameter specifying how many rows of data are written to the drill-through tables. This is especially useful for large inputs since limiting the value to a representative number of rows can help save a considerable amount of space.
When the parameter is specified, the application selects the records to be written into drill-through tables based on their "value added" to the general picture of the data or, in other words, their uniqueness. This way, given the Display Limit value, the application tries to create the most representative sample of data possible.
When drill-through is enabled, you can use it by right-clicking many of the statistics shown in the Profile Viewer (for example, median value) and selecting Drill-through.
| With time, drill-through tables can take up a lot of database space. To learn how to clean up obsolete drill-through tables, see Clean up drill-through database tables. |
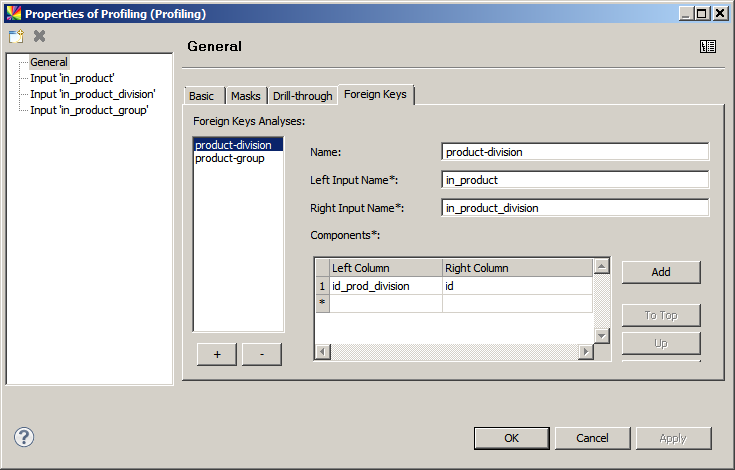
Foreign keys
Foreign key analysis can be performed when there are two or more different inputs connected to the same Profiling step. To learn how to add several inputs to the Profiling step, see Input category.
To create a new foreign ley analysis:
-
Select the plus sign (
+) at the bottom of the list. -
Enter the names of the inputs to analyze in the Left Input Name and Right Input Name fields. Press Ctrl+Space to list the step inputs for easier selection.
-
Enter columns from each input to analyze the Components section.
To learn more about how to read foreign key analysis results, see Advanced Analyses, section Foreign keys.
Input category
The Input category contains settings that are specific to each Profiling step input. To add a new input to the Profiling step, select the folder icon with a yellow plus sign above the category list. This adds a new connection point to the step icon in the Plan editor so that a new input (for example, Text File Reader or JDBC Reader step) can be connected.
After this, all additional inputs should be defined: configure which data to profile (Data tab) and, optionally, other settings as needed (described in the following sections).
To delete an input, use the adjacent red X icon.
Data
The Data tab shows all the data that will be profiled. It also contains the individual settings for each column that should be profiled.
By default, the settings that are defined in the Create Profile wizard apply to all columns, but this tab allows configuring each column separately.

The Data tab has the following configuration possibilities:
-
Expression: The name of the column or expression to profile.
-
Type: The data type of the originating input step (for example, Text File Reader) - for reference only. To change the data type of a column, use the Metadata Editor or input step.
-
Mask: Specifies which mask to use for the analysis. Choose from those defined on the Masks tab in General settings.
-
Analyze Domain: Specifies whether the Profiling step should output the domain for the given column.
-
Standard Stats: Specifies whether the Profiling step should output the standard statistics, like Minimum value, Maximum value, Extremes, and so on. This refers to the statistics on the Basics tab of the profiling results.
-
Frequency: Specifies the settings for frequency analysis of values.
-
None: Do not perform frequency analysis.
-
Discrete: Perform frequency analysis without any range limitations.
-
Range: Frequency analysis is performed on the first n number of characters, and the value of n is specified in this field.
-
-
Group Size: Specifies the settings for group size analysis, that is, the analysis of the distribution of value duplication intensity: how many values have one, two, three, and so forth duplicates. A group size of one represents unique values.
-
None: Do not perform frequency analysis.
-
Discrete: Perform frequency analysis without any range or interval limitations.
-
Range:
-
From - The starting value for the first bucket.
-
To - The starting value for the last bucket: [
<to_value>;`infinity`). -
Steps - The number of buckets.
-
-
Interval: Sets the bucket width.
-
-
Locale: Specifies the locale for the given column. If left empty, the default locale is used.
-
Comment: Free text describing the data.
When connected to an incoming step (such as Text File Reader), you can use the Fill Columns option to automatically add columns that are connected to the input rather than manually type the incoming column names. The Type column uses the types defined in the originating input step (such as Text File Reader) and is for reference only.
To change the data type of a column, use the Metadata Editor or input step.
Dependencies
The Dependencies tab can be used to define an analysis to test the dependency of the fields in one column on the fields in other columns, such as whether the birth number is related in some way to the date of birth.
To add a new dependency, select the plus sign (+).
To delete a dependency, use the minus sign (-).
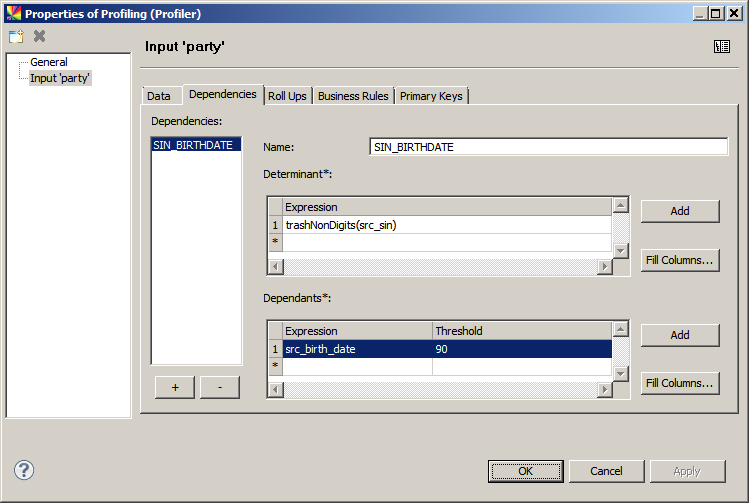
A dependency configuration consists of three parts:
-
Name: Identifier of the dependency.
-
Determinant: One or several expressions (or columns) that define the key.
-
Dependants: One or several expressions (or columns) for which the dependency is tested (these are not combined).
-
Threshold: The most frequent dependent value (modus) has to occur in at least
[threshold]percent of records with a given determinant to be considered dependent.
-
The following table demonstrates several dependencies scenarios.
| Number | Determinant | Dependant | Notes |
|---|---|---|---|
1 |
123456 |
John Smith |
The whole group of records with Determinant value '123456' is considered to be dependent only if Dependant Threshold is set to 80% or lower (only 8 of 10 records with this particular Determinant value have the same Dependant value). |
2 |
123456 |
John Smith |
|
3 |
123456 |
John Smith |
|
4 |
123456 |
John Smith |
|
5 |
123456 |
John Smith |
|
6 |
123456 |
John Smith |
|
7 |
123456 |
John Smith |
|
8 |
123456 |
John Smith |
|
9 |
123456 |
Jill Barber |
|
10 |
123456 |
Steve Goldberg |
|
11 |
111111 |
Laura Mitchel |
Violating the dependency if Threshold is set to more than 50 (only 50% percent of records with the same Determinant value have the same (the most frequent) Dependant value). |
12 |
111111 |
Miriam Green |
|
13 |
Any value |
Null Determinant. |
|
14 |
222222 |
Jim White |
Unique Determinant value. |
15 |
333333 |
Jim Bush |
Unique Determinant value. |
16 |
444444 |
Linda Smith |
Dependent. |
17 |
444444 |
Linda Smith |
|
18 |
555555 |
Berry Perry |
Dependent. |
19 |
555555 |
Berry Perry |
|
20 |
555555 |
Berry Perry |
For more details about the dependency analysis, see the Profiling step documentation in the product Help (Help > Help Contents).
To learn more about how to read dependency analysis results, see Advanced Analyses, section Dependency Analysis.
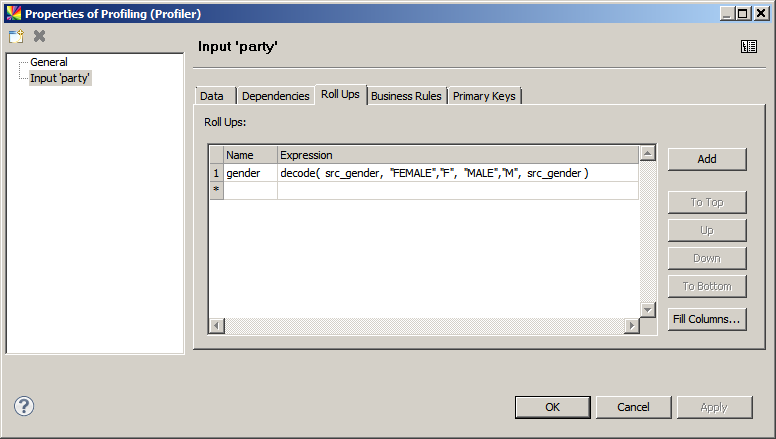
Roll Ups
A roll up is a way of looking at a specific subset of the profiled data. Entering a column name in the Roll Ups Expression field creates a list of separate profile analyses for each value of that column.
For example, if the data contains a column of genders, creating a roll up of this column allows you to view profile results for each gender value in that column, including empty rows, which might reveal new patterns in the data. When a roll up is defined, the Inputs and Roll Ups panel is shown in the Profile Viewer.
To learn more about how to read results per roll up, see Read a Data Quality Profile, section Inputs and Roll Ups.
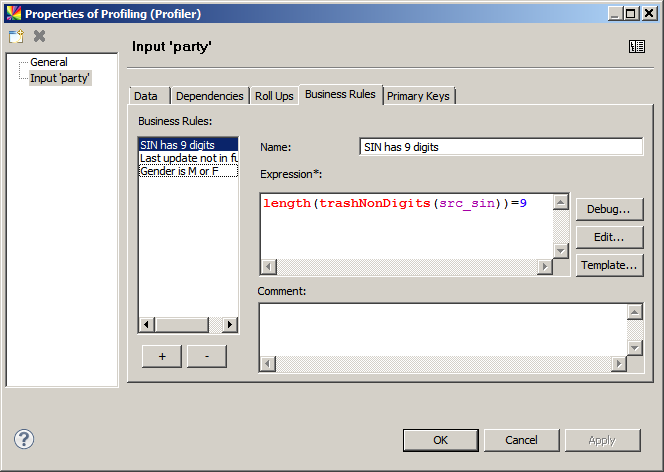
Business rules
A business rule is a Boolean expression that is evaluated and its results are presented in the Profile Viewer. Some examples are shown in this section.
For a description of available expressions and their usage, see ONE Expressions Reference.
To learn more about how to read business rule results, see Advanced Analyses, section Business Rules.
Primary keys
To analyze the uniqueness of a particular column and determine whether it is a primary key, add a new primary key analysis and enter the name of the column to analyze in the Expression field of the Components section. Several columns can be analyzed in conjunction as seen in the following example:
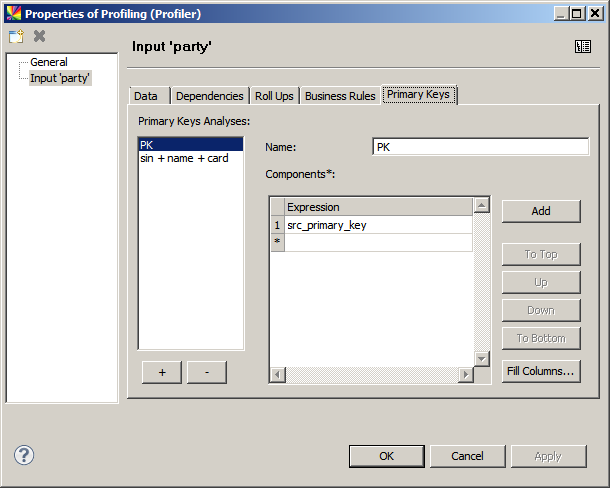
To learn more about how to read primary key analysis results, see Advanced Analyses, section Primary keys.
Configure business domain analysis
Business domain analysis tries to determine the kind of data stored in the analyzed column in the business context, for example, name, address, postal code, SWIFT code. It is possible to configure two thresholds that determine how many domains are displayed as matched in the resulting profile.
The settings are:
| Name | Default | Description |
|---|---|---|
Strict Threshold |
25 |
At least one domain has to match the percentage of records set here to be displayed in the results. |
Loose Threshold |
20 |
If at least one domain satisfies the Strict Threshold setting, other domains are shown in the results if the percentage of matching records is at least the number set here. |
To change the default settings:
-
Switch the layout of the Profiling step.
-
Select the Business Domains node.
-
Change settings and save your changes.
To learn more about how to read business domain analysis results, see Column Analyses.
Was this page useful?